k6 Load Testing Overview: Smoke, Spike, Soak, Stress
Master k6’s Go-based architecture, JavaScript scripting capabilities, and advanced workload modeling for modern DevOps and CI/CD performance testing workflows.
TLDR
k6 is a modern, developer-centric performance testing framework built on Go’s goroutines and JavaScript scripting, designed for DevOps and CI/CD workflows with exceptional resource efficiency and scalability.
Core Architecture
- Go-based Engine: High-performance execution using goroutines (lightweight threads) instead of OS threads
- JavaScript Scripting: ES6+ compatible scripting with embedded Sobek runtime (no Node.js dependency)
- Resource Efficiency: Single binary with minimal memory footprint (256MB vs 760MB for JMeter)
- Scalability: Single instance can handle 30,000-40,000 concurrent virtual users
Performance Testing Patterns
- Smoke Testing: Minimal load (3 VUs) to verify basic functionality and establish baselines
- Load Testing: Average load assessment with ramping stages to measure normal performance
- Stress Testing: Extreme loads to identify breaking points and system behavior under stress
- Soak Testing: Extended periods (8+ hours) to detect memory leaks and performance degradation
- Spike Testing: Sudden traffic bursts to test system resilience and recovery capabilities
Workload Modeling
- Closed Models (VU-based): Fixed number of virtual users, throughput as output
- Open Models (Arrival-rate): Fixed request rate, VUs as output
- Scenarios API: Multiple workload profiles in single test with parallel/sequential execution
- Executors: Constant VUs, ramping VUs, constant arrival rate, ramping arrival rate
Advanced Features
- Metrics Framework: Built-in HTTP metrics, custom metrics (Counter, Gauge, Rate, Trend)
- Thresholds: Automated pass/fail analysis with SLOs codified in test scripts
- Asynchronous Execution: Per-VU event loops for complex user behavior simulation
- Data-driven Testing: CSV/JSON data loading with SharedArray for realistic scenarios
- Environment Configuration: Environment variables for multi-environment testing
CI/CD Integration
- Tests as Code: JavaScript scripts version-controlled in Git with peer review
- Automated Workflows: Seamless integration with GitHub Actions, Jenkins, GitLab CI
- Shift-left Testing: Early performance validation in development pipeline
- Threshold Validation: Automated performance regression detection
Extensibility (xk6)
- Custom Extensions: Native Go extensions for new protocols and integrations
- Popular Extensions: Kafka, MQTT, PostgreSQL, MySQL, browser testing
- Output Extensions: Custom metric streaming to Prometheus, Elasticsearch, AWS
- Build System: xk6 tool for compiling custom k6 binaries with extensions
Developer Experience
- JavaScript API: Familiar ES6 syntax with built-in modules (k6/http, k6/check)
- CLI-first Design: Command-line interface optimized for automation
- Real-time Output: Live metrics and progress during test execution
- Comprehensive Documentation: Extensive guides and examples
Best Practices
- Incremental Complexity: Start with smoke tests, gradually increase load
- Realistic Scenarios: Model actual user behavior patterns
- Environment Parity: Test against production-like environments
- Monitoring Integration: Real-time metrics with external monitoring tools
- Performance Baselines: Establish and maintain performance thresholds
Competitive Advantages
- Resource Efficiency: 10x better memory usage compared to JMeter
- Developer Productivity: JavaScript scripting with modern tooling
- CI/CD Native: Designed for automated testing workflows
- Scalability: Single instance handles enterprise-scale loads
- Extensibility: Custom extensions for specialized requirements
Introduction
k6 represents a paradigmatic shift in performance testing, engineered from first principles for DevOps, SRE, and CI/CD pipelines. Its core innovation is a developer-centric philosophy that treats performance testing as an integral, code-driven component of the software development lifecycle rather than a post-facto quality assurance activity.
k6 targets developers, QA engineers, SDETs, and SREs who share responsibility for system performance. Its “Everything as code” approach enables test scripts to be version-controlled in Git, subjected to peer review, and seamlessly integrated into automated workflows—enabling “shift-left” testing that embeds performance validation early in the development process.
The Architectural Foundation: Go and Goroutines
Performance through Efficiency: The Go Concurrency Model
The performance and efficiency of a load generation tool are paramount, as the tool itself must not become the bottleneck in the system under test. The architectural foundation of k6 is the Go programming language, a choice that directly addresses the limitations of older, thread-heavy performance testing frameworks and provides the resource efficiency necessary for modern development practices.
Goroutines vs. Traditional Threads
The defining characteristic of k6’s performance is its use of Go’s concurrency primitives—specifically, goroutines and channels—to simulate Virtual Users (VUs). Unlike traditional tools such as JMeter, which are built on the Java Virtual Machine (JVM) and typically map each virtual user to a dedicated operating system thread, k6 leverages goroutines. Goroutines are lightweight, cooperatively scheduled threads managed by the Go runtime, not the OS kernel.
This architectural distinction has profound implications for resource consumption:
- Memory Efficiency: A standard OS thread managed by the JVM can consume a significant amount of memory, with a default stack size often starting at 1 MB. In stark contrast, a goroutine begins with a much smaller stack (a few kilobytes) that can grow and shrink as needed.
- Scalability: Analysis indicates that a single thread running k6 consumes less than 100 KB of memory, representing a tenfold or greater improvement in memory efficiency compared to a default JVM thread.
- Concurrent Users: This efficiency allows a single k6 process to effectively utilize all available CPU cores on a load generator machine, enabling a single instance to simulate tens of thousands—often between 30,000 and 40,000—concurrent VUs without succumbing to memory exhaustion.
Resource Footprint Analysis: The Foundation of “Shift-Left”
The practical benefit of this extreme resource efficiency extends beyond mere cost savings on load generation infrastructure. It is the critical technical enabler of the “shift-left” philosophy. Because k6 is distributed as a single, self-contained binary with no external dependencies like a JVM or a Node.js runtime, it is trivial to install and execute in any environment, from a developer’s local machine to a resource-constrained CI/CD runner in a container.
This stands in direct opposition to more resource-intensive, Java-based tools, which often require dedicated, high-specification hardware and careful JVM tuning to run effectively, making them impractical for frequent, automated execution as part of a development pipeline.
Installation and Setup
# macOSbrew install k6
# Dockerdocker pull grafana/k6
# Docker with browser supportdocker pull grafana/k6:master-with-browser
The Go-JavaScript Bridge: The Embedded JavaScript Runtime
While k6’s execution engine is written in high-performance Go, its test scripts are authored in JavaScript. This separation of concerns is a deliberate architectural decision, facilitated by an embedded JavaScript runtime and a sophisticated interoperability bridge.
From Goja to Sobek: The Embedded JavaScript Engine
k6 has always embedded a pure-Go JavaScript engine rather than relying on external runtimes. This architectural choice eliminates dependencies like Node.js or a JVM, simplifying installation to a single binary download and ensuring consistent behavior across environments.
Goja (2017–2024): k6 originally used goja, an ECMAScript 5.1 implementation in pure Go with emphasis on standard compliance and performance. Over the years, goja added most ES6 features, but development pace didn’t match k6’s needs for ESM (ECMAScript Modules) support.
Sobek (2024–present): In k6 v0.52.0, the Grafana team forked goja into their own project named “sobek” to accelerate development. This fork enabled faster iteration on ES6+ features and native ESM support. Starting with this release, k6 and all its extensions use Sobek for the JavaScript runtime.
The experimental_enhanced compatibility mode (introduced in v0.52.0) enables TypeScript and ES6+ support using esbuild instead of Babel, providing features like optional chaining, nullish coalescing, and class private fields.
Implications of a Non-Node.js Runtime
k6 does not run on Node.js. The embedded Sobek runtime provides a standard ECMAScript environment but does not include Node.js-specific APIs like fs (file system) or path modules, nor does it support the NPM package ecosystem directly.
While bundlers like Webpack or esbuild can transpile browser-compatible JavaScript libraries for use in k6, any library relying on native Node.js modules or OS-level access will not function. This is a deliberate design choice—k6 prioritizes a self-contained binary over Node.js ecosystem compatibility.
Your First k6 Script: Understanding the Basics
Let’s start with a simple example to understand k6’s fundamental structure:
import http from "k6/http"
export const options = { discardResponseBodies: true, // Discard response bodies if not needed for checks}
export default function () { // Make a GET request to the target URL http.get("https://test-api.k6.io")}This basic script demonstrates k6’s core concepts:
- Imports: k6 provides built-in modules like
k6/httpfor making HTTP requests - Options: Configuration object that defines test parameters
- Default Function: The main test logic that gets executed repeatedly
Asynchronous Execution Model: The Per-VU Event Loop
To accurately simulate complex user behaviors and handle modern, asynchronous communication protocols, a robust mechanism for managing non-blocking operations is essential. k6 implements a sophisticated asynchronous execution model centered around a dedicated event loop for each Virtual User.
Architecture of the VU-Scoped Event Loop
At the core of k6’s execution model is the concept that each Virtual User (VU) operates within a completely isolated, self-contained JavaScript runtime. A critical component of this runtime is its own dedicated event loop. This is not a single, global event loop shared across all VUs, but rather a distinct event loop instantiated for each concurrent VU.
This architectural choice is fundamental to ensuring that:
- The actions and state of one VU do not interfere with another
- Asynchronous operations within a single VU’s iteration do not “leak” into subsequent iterations
- Each iteration is a discrete and independent unit of work
Managing Asynchronous Operations
The interaction between the JavaScript runtime and the Go-based event loop is governed by a strict and explicit contract. When a JavaScript function needs to perform an asynchronous operation (e.g., an HTTP request), the underlying Go module must signal its intent to the event loop via the RegisterCallback() function.
This mechanism ensures that the event loop is fully aware of all pending asynchronous operations and will not consider an iteration complete until every registered callback has been enqueued and processed. This robust contract enables k6 to correctly support modern JavaScript features like async/await and Promises.
Modeling Reality: Advanced Workload Simulation with Scenarios and Executors
A performance test’s value is directly proportional to its ability to simulate realistic user traffic patterns. k6 provides a highly sophisticated and flexible framework for workload modeling through its Scenarios and Executors API.
The Scenario API: Composing Complex, Multi-Stage Tests
The foundation of workload modeling in k6 is the scenarios object, configured within the main test options. This API allows for the definition of multiple, distinct workload profiles within a single test script, providing granular control over how VUs and iterations are scheduled.
Each property within the scenarios object defines a unique scenario that can:
- Execute a different function using the
execproperty - Have a distinct load profile through assigned executors
- Possess unique tags and environment variables
- Run in parallel or sequentially using the
startTimeproperty
Executor Deep Dive: Open vs. Closed Models
The behavior of each scenario is dictated by its assigned executor. k6 provides a variety of executors that can be broadly categorized into two fundamental workload models:
Closed Models (VU-based)
In a closed model, the number of concurrent VUs is the primary input parameter. The system’s throughput (e.g., requests per second) is an output of the test, determined by how quickly the system under test can process the requests from the fixed number of VUs.
Example: Constant VUs
import http from "k6/http"
export const options = { discardResponseBodies: true, vus: 10, // Fixed number of VUs duration: "30s", // Test duration}
export default function () { http.get("https://test-api.k6.io")}Example: Ramping VUs
import http from "k6/http"
export const options = { discardResponseBodies: true, stages: [ { duration: "30s", target: 20 }, // Ramp up to 20 VUs { duration: "1m", target: 20 }, // Stay at 20 VUs { duration: "30s", target: 0 }, // Ramp down to 0 VUs ],}
export default function () { http.get("https://test-api.k6.io")}Open Models (Arrival-Rate)
In an open model, the rate of new arrivals (iterations per unit of time) is the primary input parameter. The number of VUs required to sustain this rate is an output of the test.
Example: Constant Arrival Rate
import http from "k6/http"
export const options = { discardResponseBodies: true, scenarios: { constant_request_rate: { executor: "constant-arrival-rate", rate: 10, // Target RPS timeUnit: "1s", duration: "30s", preAllocatedVUs: 5, // Initial VUs maxVUs: 20, // Maximum VUs }, },}
export default function () { http.get("https://test-api.k6.io")}Example: Ramping Arrival Rate
2 collapsed lines
import http from "k6/http"
export const options = { discardResponseBodies: true, scenarios: { ramping_arrival_rate: { executor: "ramping-arrival-rate", startRate: 1, // Initial RPS timeUnit: "1s", preAllocatedVUs: 5, maxVUs: 20, stages: [ { duration: "5s", target: 5 }, // Ramp up to 5 RPS { duration: "10s", target: 5 }, // Constant load at 5 RPS { duration: "5s", target: 10 }, // Ramp up to 10 RPS { duration: "10s", target: 10 }, // Constant load at 10 RPS { duration: "5s", target: 15 }, // Ramp up to 15 RPS { duration: "10s", target: 15 }, // Constant load at 15 RPS ], }, },}
export default function () {2 collapsed lines
http.get("https://test-api.k6.io")}Multiple Scenarios: Complex Workload Simulation
k6 allows running multiple scenarios in a single test, enabling complex workload simulation:
2 collapsed lines
import http from "k6/http"
export const options = { discardResponseBodies: true, scenarios: { // Scenario 1: Constant load for API testing api_load: { executor: "constant-arrival-rate", rate: 50, timeUnit: "1s", duration: "2m", preAllocatedVUs: 10, maxVUs: 50, }, // Scenario 2: Ramping load for web testing web_load: { executor: "ramping-vus", startVUs: 0, stages: [ { duration: "1m", target: 20 }, { duration: "1m", target: 20 }, { duration: "1m", target: 0 }, ], }, },}
export default function () {2 collapsed lines
http.get("https://test-api.k6.io")}Performance Testing Scenarios: From Smoke to Stress
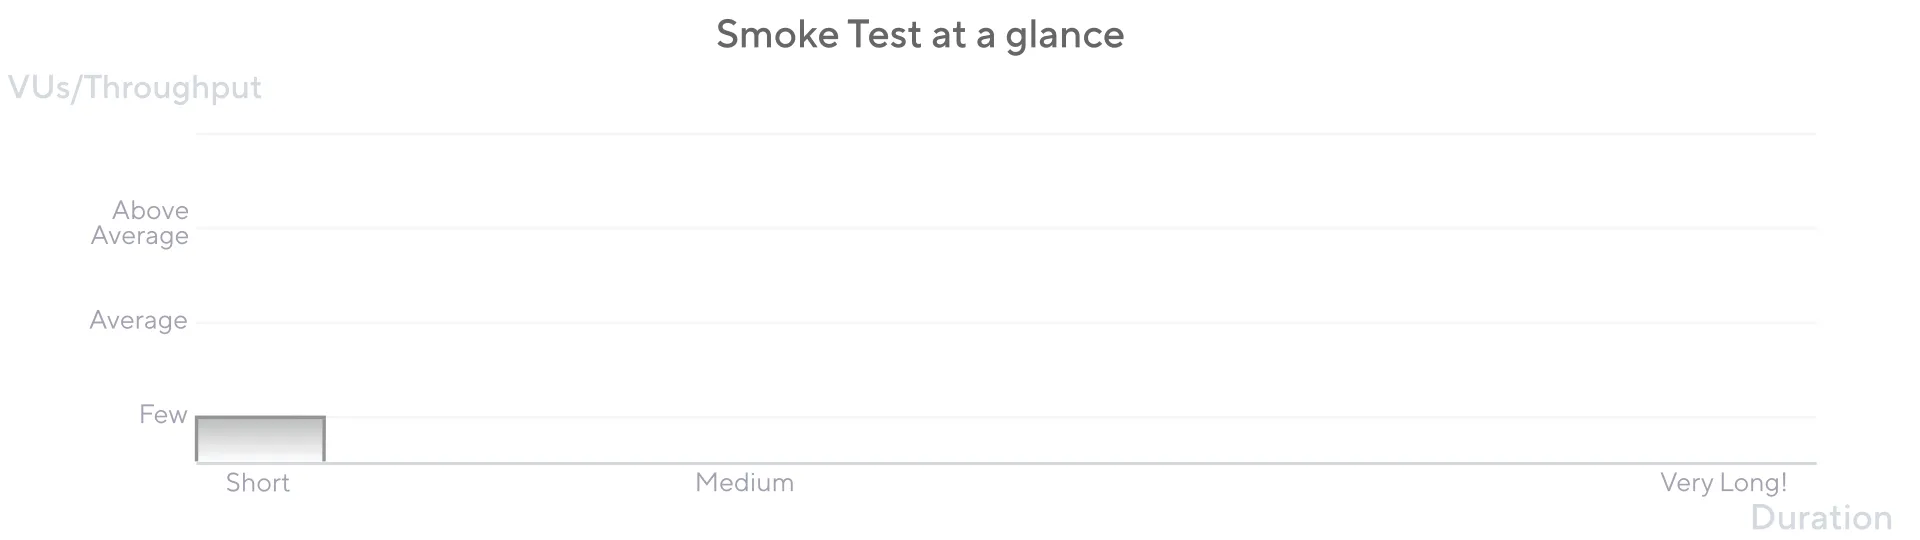
Smoke Testing: Foundation Validation
Smoke tests have minimal load and are used to verify that the system works well under minimal load and to gather baseline performance values.
2 collapsed lines
import http from "k6/http"import { check, sleep } from "k6"
export const options = { vus: 3, // Minimal VUs for smoke test duration: "1m", thresholds: { http_req_duration: ["p(95)<500"], // 95% of requests under 500ms http_req_failed: ["rate<0.01"], // Less than 1% failure rate },}
export default function () { const response = http.get("https://test-api.k6.io")
check(response, { "status is 200": (r) => r.status === 200, "response time < 500ms": (r) => r.timings.duration < 500, })
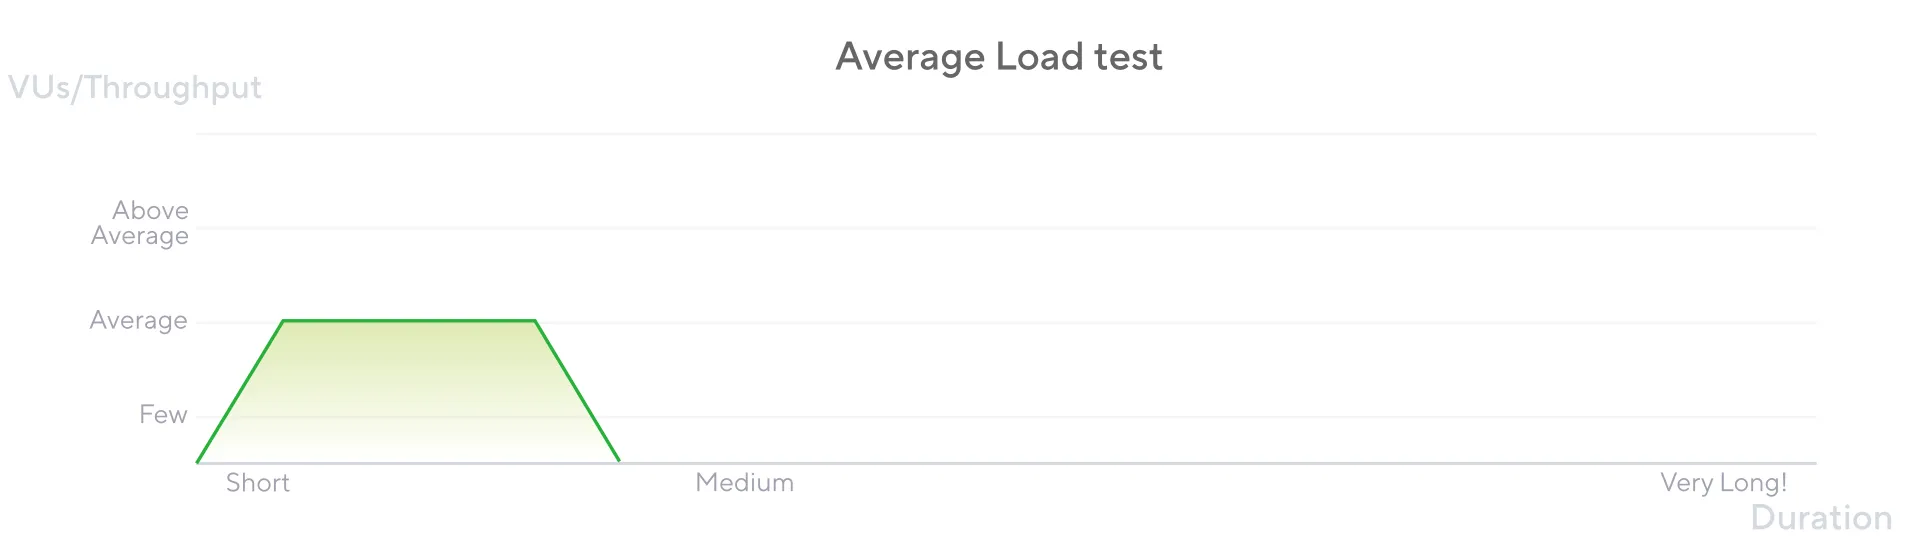
sleep(1)}Load Testing: Average Load Assessment
Load testing assesses how the system performs under typical load conditions.
2 collapsed lines
import http from "k6/http"import { sleep } from "k6"
export const options = { stages: [ { duration: "5m", target: 100 }, // Ramp up to 100 users { duration: "30m", target: 100 }, // Stay at 100 users { duration: "5m", target: 0 }, // Ramp down to 0 users ], thresholds: { http_req_duration: ["p(95)<1000"], // 95% under 1 second http_req_failed: ["rate<0.05"], // Less than 5% failure rate },}
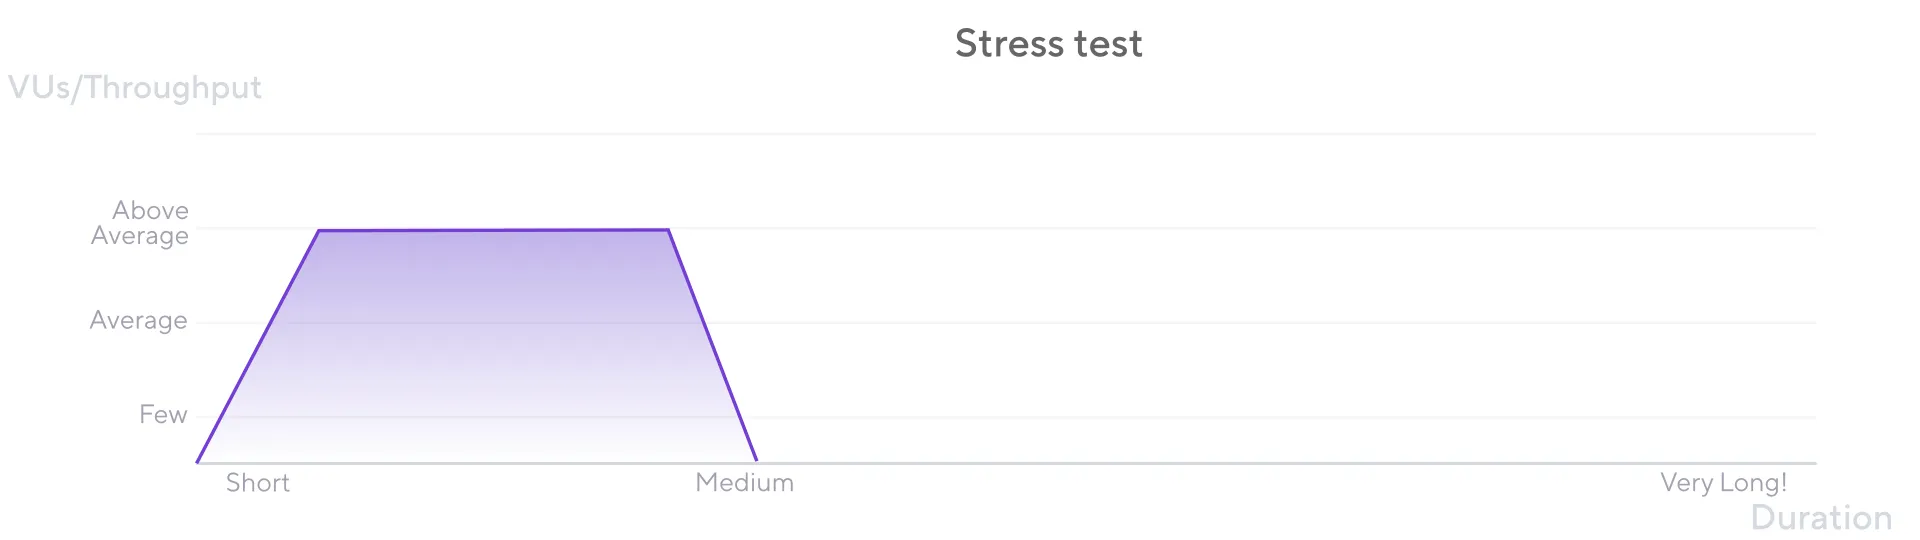
export default function () { http.get("https://test-api.k6.io") sleep(1)}Stress Testing: Breaking Point Analysis
Stress testing subjects the application to extreme loads to identify its breaking point and assess its behavior under stress.
2 collapsed lines
import http from "k6/http"import { sleep } from "k6"
export const options = { stages: [ { duration: "10m", target: 200 }, // Ramp up to 200 users { duration: "30m", target: 200 }, // Stay at 200 users { duration: "5m", target: 0 }, // Ramp down to 0 users ], thresholds: { http_req_duration: ["p(95)<2000"], // 95% under 2 seconds http_req_failed: ["rate<0.10"], // Less than 10% failure rate },}
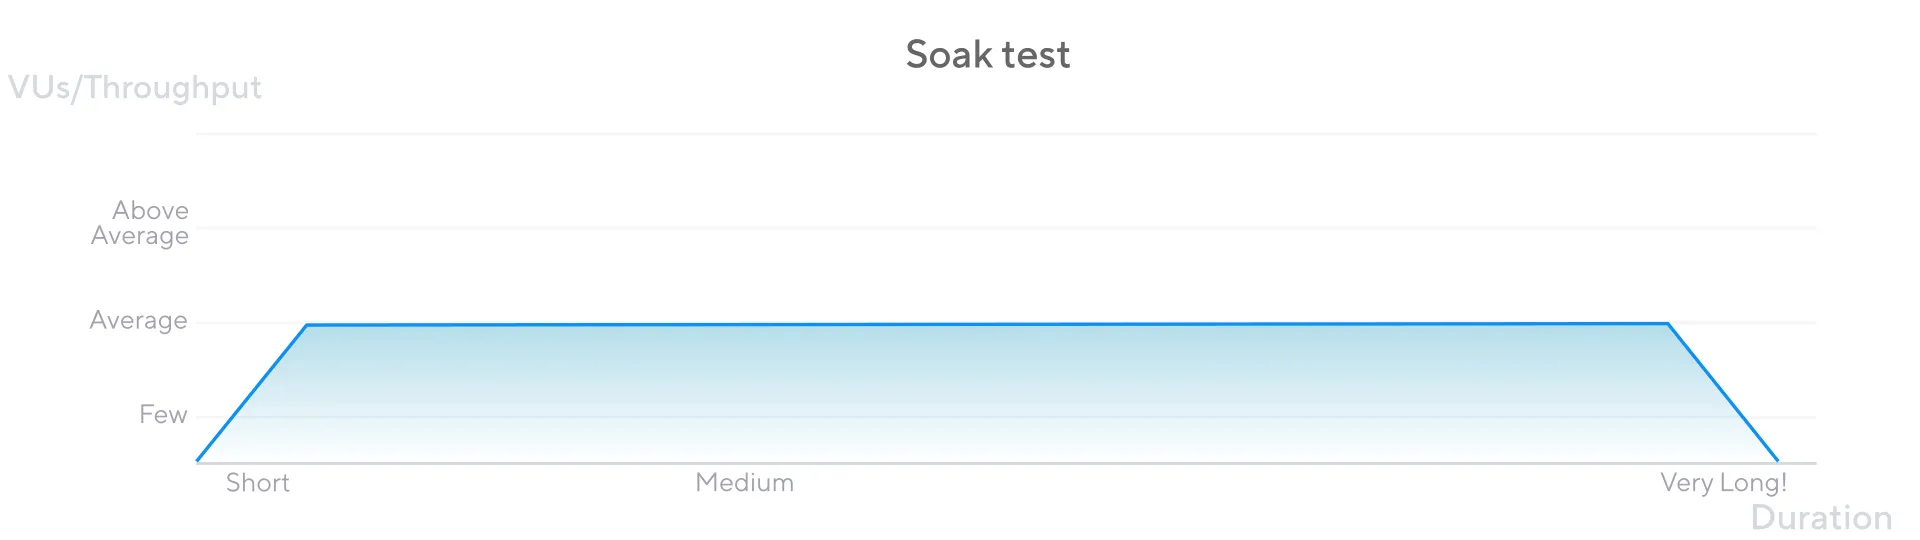
export default function () { http.get("https://test-api.k6.io") sleep(1)}Soak Testing: Long-term Stability
Soak testing focuses on extended periods to analyze performance degradation and resource consumption over time.
2 collapsed lines
import http from "k6/http"import { sleep } from "k6"
export const options = { stages: [ { duration: "5m", target: 100 }, // Ramp up to 100 users { duration: "8h", target: 100 }, // Stay at 100 users for 8 hours { duration: "5m", target: 0 }, // Ramp down to 0 users ], thresholds: { http_req_duration: ["p(95)<1500"], // 95% under 1.5 seconds http_req_failed: ["rate<0.02"], // Less than 2% failure rate },}
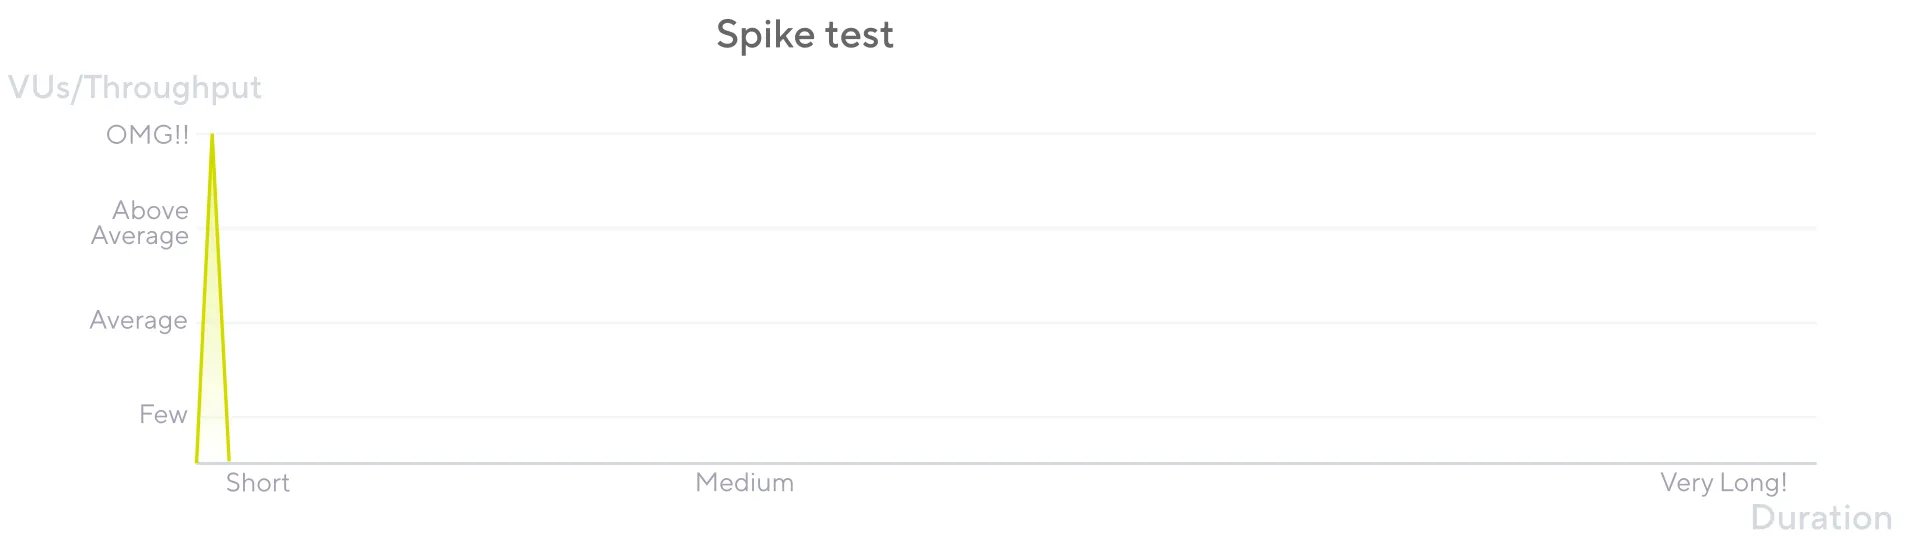
export default function () { http.get("https://test-api.k6.io") sleep(1)}Spike Testing: Sudden Traffic Bursts
Spike testing verifies whether the system survives and performs under sudden and massive rushes of utilization.
2 collapsed lines
import http from "k6/http"import { sleep } from "k6"
export const options = { stages: [ { duration: "2m", target: 2000 }, // Fast ramp-up to 2000 users { duration: "1m", target: 0 }, // Quick ramp-down to 0 users ], thresholds: { http_req_duration: ["p(95)<3000"], // 95% under 3 seconds http_req_failed: ["rate<0.15"], // Less than 15% failure rate },}
export default function () { http.get("https://test-api.k6.io") sleep(1)}Quantifying Performance: The Metrics and Thresholds Framework
Generating load is only one half of performance testing; the other, equally critical half is the collection, analysis, and validation of performance data. k6 incorporates a robust and flexible framework for handling metrics.
The Metrics Pipeline: Collection, Tagging, and Aggregation
By default, k6 automatically collects a rich set of built-in metrics relevant to the protocols being tested. For HTTP tests, this includes granular timings for each stage of a request:
http_req_blocking: Time spent waiting for a connection slothttp_req_connecting: Time spent establishing TCP connectionhttp_req_tls_handshaking: Time spent in TLS handshakehttp_req_sending: Time spent sending datahttp_req_waiting: Time spent waiting for response (TTFB)http_req_receiving: Time spent receiving response datahttp_req_duration: Total request durationhttp_req_failed: Request failure rate
Metric Types
All metrics in k6 fall into one of four fundamental types:
- Counter: A cumulative metric that only ever increases (e.g.,
http_reqs) - Gauge: A metric that stores the last recorded value (e.g.,
vus) - Rate: A metric that tracks the percentage of non-zero values (e.g.,
http_req_failed) - Trend: A statistical metric that calculates aggregations like percentiles (e.g.,
http_req_duration)
Creating Custom Metrics
k6 provides a simple yet powerful API for creating custom metrics:
2 collapsed lines
import http from "k6/http"import { Trend, Rate, Counter } from "k6/metrics"import { sleep } from "k6"
// Custom metricsconst loginTransactionDuration = new Trend("login_transaction_duration")const loginSuccessRate = new Rate("login_success_rate")const totalLogins = new Counter("total_logins")
export const options = {4 collapsed lines
vus: 10, duration: "30s",}
export default function () { const startTime = Date.now()
// Simulate login process const loginResponse = http.post("https://test-api.k6.io/login", { username: "testuser", password: "testpass", })
const endTime = Date.now() const transactionDuration = endTime - startTime
// Record custom metrics loginTransactionDuration.add(transactionDuration) loginSuccessRate.add(loginResponse.status === 200) totalLogins.add(1)
sleep(1)}Codifying SLOs with Thresholds
Thresholds serve as the primary mechanism for automated pass/fail analysis. They are performance expectations, or Service Level Objectives (SLOs), that are codified directly within the test script’s options object.
3 collapsed lines
import http from "k6/http"import { check, sleep } from "k6"
export const options = { vus: 10, duration: "30s", thresholds: { // Response time thresholds http_req_duration: ["p(95)<500", "p(99)<1000"],
// Error rate thresholds http_req_failed: ["rate<0.01"],
// Custom metric thresholds login_transaction_duration: ["p(95)<2000"], login_success_rate: ["rate>0.99"], },}
export default function () { const response = http.get("https://test-api.k6.io")
check(response, { "status is 200": (r) => r.status === 200, "response time < 500ms": (r) => r.timings.duration < 500, })
sleep(1)}Comparative Analysis: k6 in the Landscape of Performance Tooling
The selection of a performance testing tool is a significant architectural decision that reflects an organization’s technical stack, development culture, and operational maturity.
Architectural Showdown: Runtime Comparison
| Framework | Core Language/Runtime | Concurrency Model | Scripting Language | Resource Efficiency | CI/CD Integration |
|---|---|---|---|---|---|
| k6 | Go | Goroutines (Lightweight Threads) | JavaScript (ES6) | Very High | Excellent |
| JMeter | Java / JVM | OS Thread-per-User | Groovy (optional) | Low | Moderate |
| Gatling | Scala / JVM (Akka/Netty) | Asynchronous / Event-Driven | Scala DSL | Very High | Excellent |
| Locust | Python | Greenlets (gevent) | Python | High | Excellent |
Resource Efficiency Analysis
Multiple independent benchmarks corroborate k6’s architectural advantages:
- Memory Usage: k6 uses approximately 256 MB versus 760 MB for JMeter to accomplish similar tasks
- Concurrent Users: A single k6 instance can handle loads that would require a distributed, multi-machine setup for JMeter
- Performance-per-Resource: k6’s Go-based architecture provides superior performance-per-resource ratio
Developer Experience and CI/CD Integration
k6, Gatling, and Locust all champion a “tests-as-code” philosophy, allowing performance tests to be treated like any other software artifact. This makes them exceptionally well-suited for modern DevOps workflows.
JMeter, in contrast, is primarily GUI-driven, presenting significant challenges in a CI/CD context due to its reliance on XML-based .jmx files that are difficult to read, diff, and merge in version control.
Extending the Core: The Power of xk6
No single tool can anticipate every future protocol, data format, or integration requirement. xk6 provides a robust mechanism for building custom versions of the k6 binary, allowing the community and individual organizations to extend its core functionality with native Go code.
xk6 Build System
xk6 is a command-line tool designed to compile the k6 source code along with one or more extensions into a new, self-contained k6 executable:
# Build k6 with Kafka extensionxk6 build --with github.com/grafana/xk6-kafka
# Build k6 with multiple extensionsxk6 build --with github.com/grafana/xk6-kafka --with github.com/grafana/xk6-mqtt
Extension Types
Extensions can be of two primary types:
- JavaScript Extensions: Add new built-in JavaScript modules (e.g.,
import kafka from 'k6/x/kafka') - Output Extensions: Add new options for the
--outflag, allowing test metrics to be streamed to custom backends
Popular Extensions
- Messaging Systems: Apache Kafka, MQTT, NATS
- Databases: PostgreSQL, MySQL
- Custom Outputs: Prometheus Pushgateway, Elasticsearch, AWS Timestream
- Browser Testing: xk6-browser (Playwright integration)
Advanced k6 Features for Production Use
Environment-Specific Configuration
2 collapsed lines
import http from "k6/http"import { sleep } from "k6"
const BASE_URL = __ENV.BASE_URL || "https://test-api.k6.io"const VUS = parseInt(__ENV.VUS) || 10const DURATION = __ENV.DURATION || "30s"
export const options = { vus: VUS, duration: DURATION, thresholds: { http_req_duration: ["p(95)<500"], http_req_failed: ["rate<0.01"], },}
export default function () { http.get(`${BASE_URL}/api/endpoint`) sleep(1)}Data-Driven Testing
3 collapsed lines
import http from "k6/http"import { SharedArray } from "k6/data"import { sleep } from "k6"
// Load test data from CSVconst users = new SharedArray("users", function () { return open("./users.csv").split("\n").slice(1) // Skip header})
5 collapsed lines
export const options = { vus: 10, duration: "30s",}
export default function () { const user = users[Math.floor(Math.random() * users.length)] const [username, password] = user.split(",")
const response = http.post("https://test-api.k6.io/login", { username: username, password: password, })
sleep(1)}Complex User Journeys
2 collapsed lines
import http from "k6/http"import { check, sleep } from "k6"
export const options = {4 collapsed lines
vus: 10, duration: "30s",}
export default function () { // Step 1: Login const loginResponse = http.post("https://test-api.k6.io/login", { username: "testuser", password: "testpass", })
check(loginResponse, { "login successful": (r) => r.status === 200, })
if (loginResponse.status === 200) { const token = loginResponse.json("token")
// Step 2: Get user profile const profileResponse = http.get("https://test-api.k6.io/profile", { headers: { Authorization: `Bearer ${token}` }, })
check(profileResponse, { "profile retrieved": (r) => r.status === 200, })
// Step 3: Update profile const updateResponse = http.put("https://test-api.k6.io/profile", JSON.stringify({ name: "Updated Name" }), { headers: { Authorization: `Bearer ${token}`, "Content-Type": "application/json", }, })
check(updateResponse, { "profile updated": (r) => r.status === 200, }) }
sleep(1)}Integration with CI/CD Pipelines
GitHub Actions Example
name: Performance Tests
on: [push, pull_request]
jobs: performance: runs-on: ubuntu-latest steps: - uses: actions/checkout@v3
- name: Install k6 run: | curl -L https://github.com/grafana/k6/releases/download/v0.47.0/k6-v0.47.0-linux-amd64.tar.gz | tar xz sudo cp k6-v0.47.0-linux-amd64/k6 /usr/local/bin
- name: Run smoke test run: k6 run smoke-test.js
- name: Run load test run: k6 run load-test.js if: github.ref == 'refs/heads/main'Jenkins Pipeline Example
pipeline { agent any
stages { stage('Smoke Test') { steps { sh 'k6 run smoke-test.js' } }
stage('Load Test') { when { branch 'main' } steps { sh 'k6 run load-test.js' } } }
post { always { publishHTML([ allowMissing: false, alwaysLinkToLastBuild: true, keepAll: true, reportDir: 'k6-results', reportFiles: 'index.html', reportName: 'K6 Performance Report' ]) } }}Best Practices for k6 Performance Testing
1. Test Design Principles
- Start Simple: Begin with smoke tests to establish baselines
- Incremental Complexity: Gradually increase test complexity and load
- Realistic Scenarios: Model actual user behavior patterns
- Environment Parity: Test against environments that mirror production
2. Script Organization
// config.js - Centralized configurationexport const config = { baseUrl: __ENV.BASE_URL || "https://test-api.k6.io", timeout: "30s", thresholds: { http_req_duration: ["p(95)<500"], http_req_failed: ["rate<0.01"], },}
// utils.js - Shared utilitiesexport function generateRandomUser() { return { username: `user_${Math.random().toString(36).substr(2, 9)}`, email: `user_${Math.random().toString(36).substr(2, 9)}@example.com`, }}
// main-test.js - Main test scriptimport { config } from "./config.js"import { generateRandomUser } from "./utils.js"
export const options = { vus: 10, duration: "30s", ...config,}
export default function () { const user = generateRandomUser() // Test logic here}3. Monitoring and Observability
- Real-time Metrics: Use k6’s real-time output for immediate feedback
- External Monitoring: Integrate with Grafana, Prometheus, or other monitoring tools
- Logging: Implement structured logging for debugging
- Alerts: Set up automated alerts for threshold violations
4. Performance Baselines
2 collapsed lines
import http from "k6/http"import { check, sleep } from "k6"
export const options = { vus: 1, duration: "1m", thresholds: { // Establish baseline thresholds http_req_duration: ["p(95)<200"], // Baseline: 95% under 200ms http_req_failed: ["rate<0.001"], // Baseline: Less than 0.1% failures },}
export default function () { const response = http.get("https://test-api.k6.io")
check(response, { "status is 200": (r) => r.status === 200, "response time < 200ms": (r) => r.timings.duration < 200, })
sleep(1)}Conclusion
k6’s strength comes from deliberate architectural choices that work together:
-
Resource Efficiency: Go’s goroutine-based concurrency enables meaningful performance testing in resource-constrained CI/CD environments—256 MB vs 760 MB for equivalent JMeter tests.
-
Developer Experience: JavaScript scripting with a “tests-as-code” ethos lowers barriers and empowers developers to own performance testing.
-
Workload Modeling: The Scenarios and Executors API enables accurate simulation of real-world traffic patterns beyond simplistic load generation.
-
Automated Validation: Built-in metrics, custom metrics, tagging, and thresholds create a closed-loop system that transforms performance data into actionable pass/fail results.
-
Extensibility: The xk6 framework provides community-driven innovation for new protocols and integrations.
k6’s integration with the Grafana ecosystem, open-source nature, and active development position it well for evolving cloud-native architectures. For teams implementing shift-left performance testing, k6 offers a compelling combination of technical excellence and developer productivity.